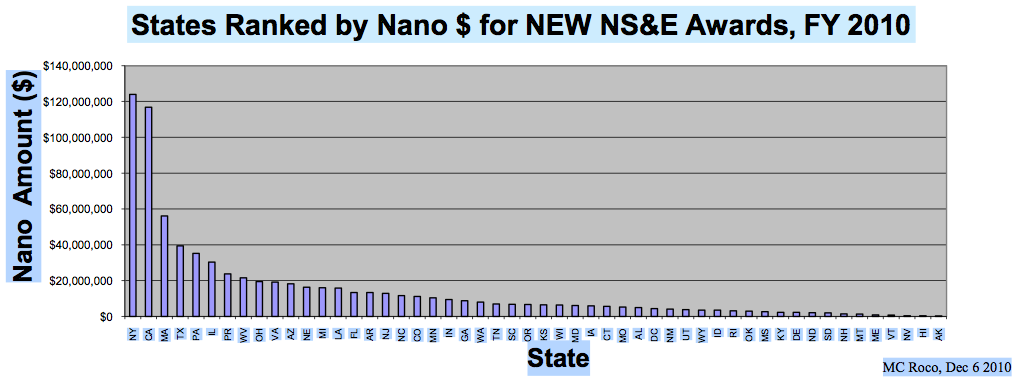
December 8, 2010 Larry Bell This chart says it all (click on it to see a version large enough to read): This chart was part of Mike Roco's presentation at the 2010 NSF NSE Grantee Meeting.